Solving a Murder Mystery
A coworker asked me if I ever write about difficult bugs I’ve encountered. I hadn’t thought about doing that before, but I like the idea. The conversation made me think about a bug I ran into at Honeycomb that I want to document before I forget the details. Solving this one was a team effort, requiring different insights from different people. It was also the kind of bug I could only imagine solving with good observability and teamwork.
I will detail how some of Honeycomb’s systems worked when I worked there. This, and the details of the bug, are from memory so something is bound to be incorrect. Also, a lot has changed since then, so this isn’t intended to be current. Finally, because I no longer work at Honeycomb, I don’t have access to the queries we ran while debugging this issue, so you’ll have to settle for my hand-drawn approximations! (did you know that queries in Honeycomb last forever so you can always refer back to them? Seriously underrated feature if you ask me).
Context
Honeycomb is an observability tool. It is a service that accepts ultra-wide events (as JSON or OpenTelemetry Protocol) and stores them in datasets. Users run queries against their datasets, slicing and dicing them by multiple dimensions.
Honeycomb can serve most queries in a second or two, and queries can be filtered on or grouped by high cardinality fields. Example queries that a user may run include “Show me the P95 and a heatmap of latency of requests to a particular endpoint in one of two provided availability zones, grouped by customer id over the last two days.”. Or “Show me counts of requests grouped by HTTP status codes over the last two weeks.”.
The Symptom
A customer complained that a specific query was consistently generating an error. The particular error message they were seeing usually indicated a timeout, which generally indicates an availability problem with our columnar datastore. However, this case was consistently reproducible, pointing to a problem with this specific query, not database availability. There was a problem with the data causing errors in the query processor—running the same query with different time windows produced no error, providing further evidence for the bad data theory.
Technical Details
Honeycomb stores events in a custom columnar datastore called retriever. Retriever stores all customer events and processes queries for customers.
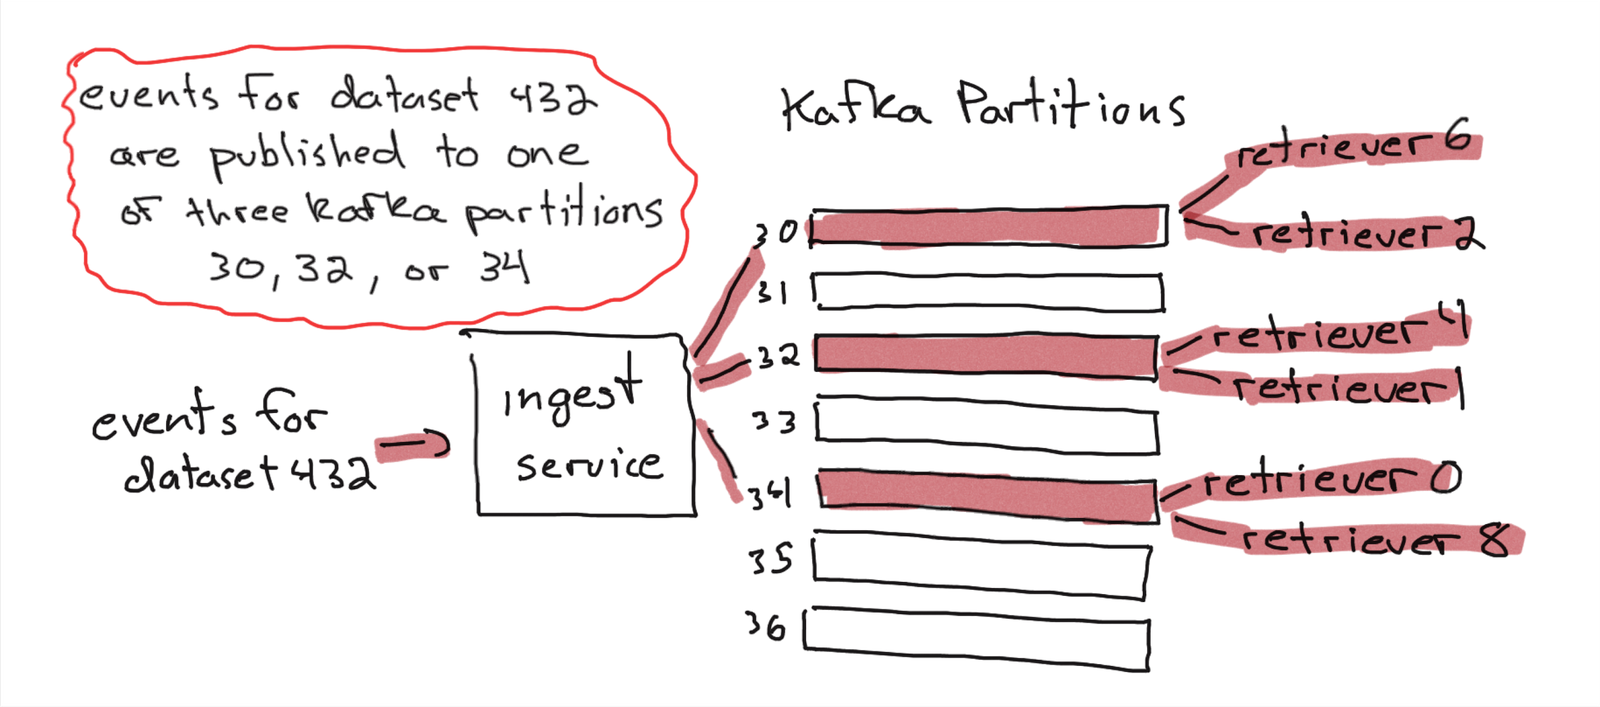
All customer events flow through a distributed event store, Kafka. Honeycomb maintains a mapping of customer datasets to Kafka partitions (higher volume datasets get more partitions). When an event is received by Honeycomb’s ingest service, it is published to one of the Kafka partitions that the customer dataset is mapped to. At the other end of the Kafka partitions, two redundant retriever nodes consume events and persist them to their local disks. Event logs are append-only, and retriever nodes have fast nvme disks.

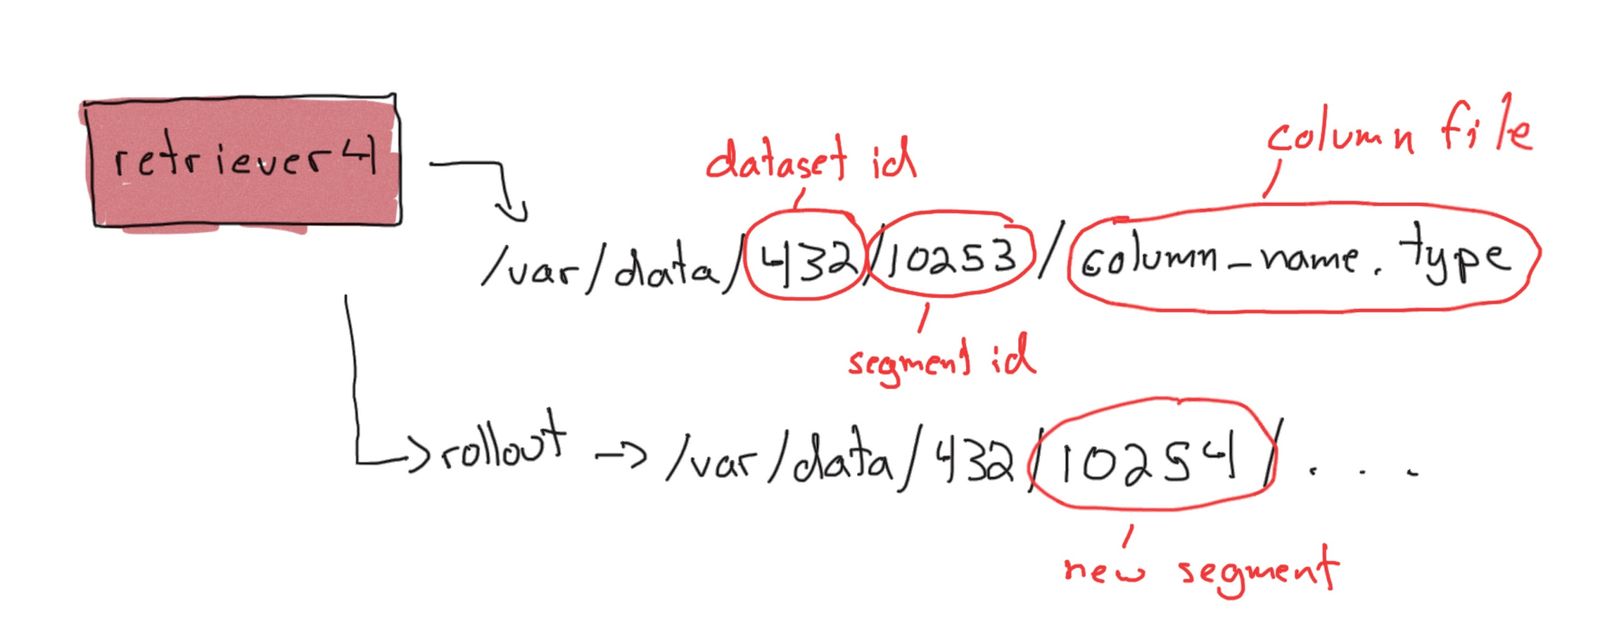
When a retriever node consumes an event, it writes the event to separate files per column. Retriever groups events into segments. Segments are routinely rolled out (when I worked at Honeycomb, they were marked read-only, and a new segment was created when the segment hit 1 million events, 1GB of data, or when 12 hours had passed).

An out-of-band process manages the lifecycle of segments. Segments go from being live and having data written to them, to being read-only but still stored on disk, to being read-only and stored in S3, and finally to being tombstoned and eventually deleted when the data ages out (it is no longer queryable).
When a query is processed, each retriever node that could have data for the query processes the data it has on disk. Data from segments in S3 is retrieved and processed with lambda functions, which merge with the results from the retriever nodes. AWS Lambda functions are a core part of how retriever processes queries.
Custom Instrumentation to the Rescue
Okay, back to the problem. At this point, I’m assuming that there’s a piece of bad data causing the queries to fail. I narrowed it down to a one-minute range of data, so I was confident in this hypothesis. However, I assumed it was a problem with invalid data (e.g., a division by zero error somehow being thrown by Honeycomb’s derived column DSL).
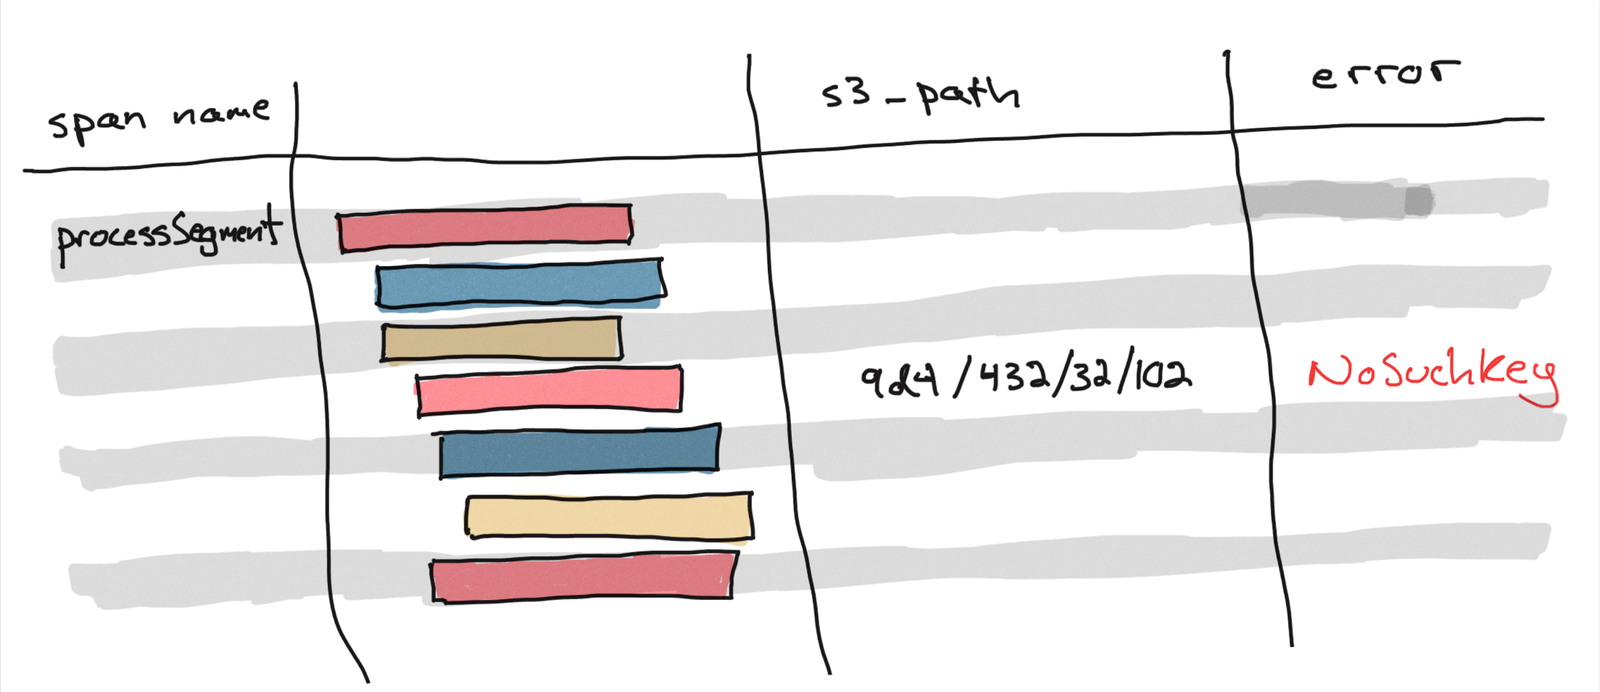
One of my coworkers started looking at traces and noticed that the lambda functions had an error message that read NoSuchKey in the error field of the span. The custom error field alerted us to the possibility that the segment was somehow missing from S3 – we independently confirmed this by trying to fetch one of the bad segments using the AWS CLI tool and seeing it return a 404.

This discovery was a scary realization - data we thought we had stored was missing!
NOTE: While losing data is always scary, especially when the scope is unknown, a single segment represents a relatively tiny amount of data. If the query wasn’t failing, none of the aggregate values (SUM, AVG, P95, etc) in an average sized dataset would be noticeably skewed by a single missing segment when queried over a typical time window. While observability data is fundamentally lossy and data loss isn’t great, it doesn’t have the same criticality as say, a transactional database.
S3 Prefixes
Before continuing, it’s necessary to understand how Honeycomb stores segments in S3.
S3 is a great storage system. It allows Honeycomb to store a massive volume of events, enabling customers to query their data over long time windows (The default is 60 days as of this writing).
To optimize performance and avoid hotspots, it’s a good practice to prefix objects in a bucket with high variability. An engineer at Honeycomb had previously led a project to design a prefixing scheme for our segments. When uploading to S3, objects are given a fixed-length hash code as a prefix. We calculate the hash code from the dataset id, the partition id, and the segment id. For example, given dataset id 432, partition id 32, and segment id 1023:
hash(432, 32, 1023) = 9d4
We then prepend this prefix to the S3 object name when uploading the segment, so the object name for files in segment 10253 on partition 32 and dataset 432 would have a prefix like this:
9d4/432/32/10253
Without the hashing, all objects in segments for dataset id 432 would have the same prefix. If 432 is a frequently queried, huge dataset, this could result in hotspots and performance degradations.
Finding Needles in Haystacks
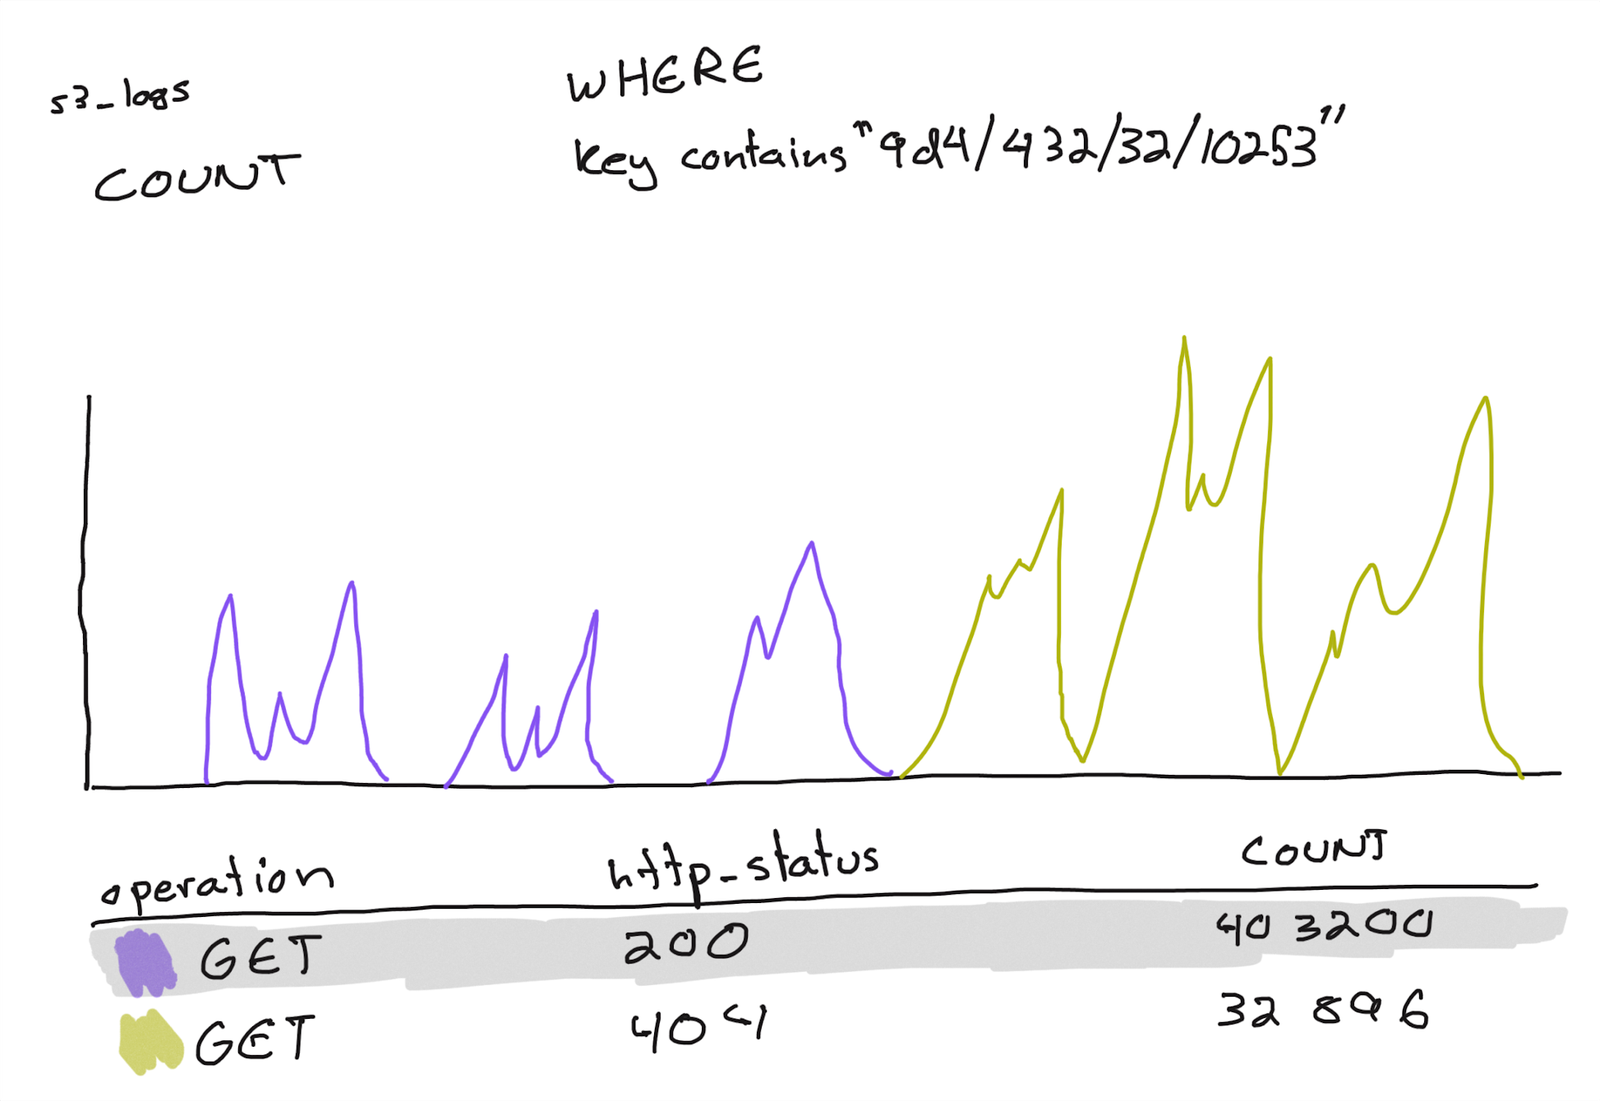
So we knew that specific segments did not exist in S3. Now what? Failing to store data is pretty bad. We started combing through our S3 logs dataset in Honeycomb to find out what happened. We saw that requests for one of the problem segments went from returning 200 (OK) to suddenly returning 404 (Not Found). Okay, so the segment existed at some point, and then it didn’t.

Because of the overall volume, the S3 logs dataset we stored in Honeycomb is heavily sampled. If an errant process deleted the problem segment, it’s unlikely we would have the specific log line in our dataset.
As mentioned previously, retriever has an out-of-band process that manages the lifecycle of segments, including deleting the segments from S3. Still, it should only delete segments that have aged out. These segments that suddenly went missing were still supposed to be serving data.
Another engineer downloaded a huge trove of S3 logs and started running parallel grep tasks to find entries related to the problem segment. This was challenging - Honeycomb has many terabytes of S3 logs. Nevertheless, we hit the jackpot. The log files showed that when the out-of-band process deleted an aged-out segment with a name like 9d4/432/32/102, it also deleted a newer segment with a name like 9d4/432/32/10253. This accidental deletion only happened to a few segments out of billions, but that’s enough to fail a query if the time window spans the data contained in the missing segment.
Another engineer confirmed this by running a Honeycomb query showing that on sequential runs, our out-of-band lifecycle manager showed an unusually high count of objects deleted for a really old segment and then no objects deleted on the next run.
Looking closer at the code, I confirmed we were not appending a trailing forward slash to S3 objects when deleting aged-out segments from S3. We were using the S3 API in such a way to emulate deleting all “files” in a “directory”, so the provided key was not an object name, but a prefix. When we deleted 9d4/432/32/102, a very old segment, we were also deleting 9d4/432/32/10253 because the two segments were part of the same dataset, came in through the same partition, both had segment ids that began with 102, and happened to have a hash collision. We really should have been deleting 9d4/432/32/102/.
Hash collisions are common at scale, but in this case, the hash was never supposed to guarantee the uniqueness of keys. It just needed to spread out the prefix scheme so segments from the same dataset wouldn’t get grouped together. Some collisions were acceptable and even expected because the other components that made up the S3 object name would be different (even if the dataset and partition are the same, the segment id wouldn’t be).
The real issue here was a bug in our segment lifecycle management process. A simple missing trailing slash was inadvertently deleting more data than intended (Honeycomb employees love puns, so someone dubbed this murder mystery a “real slasher”). Funny enough, because hash collisions don’t happen all of the time, our prefixing scheme ended up hiding this bug from us for a long time. This bug would have been immediately apparent if we weren’t prepending segments with a fixed-width hash code.
The fix ended up being about twenty lines of code, including comments. I think I had it ready and submitted a PR within 15 minutes of the team discovering the source of the bug.
A Series of Coincidences
Someone pointed out that there are some fun statistical properties to this bug. For instance, while hash collisions are pretty common at scale, they only matter here if the two segments are on the same dataset, on the same partition, and have ids with the same first digit or digits. A hash collision wouldn’t matter if the paths end up being completely different anyway (e.g. 9d4/432/32/10253 and 9d4/321/23/43).
This bug skews heavily towards newer customers who generated a lot of events – these customers create new datasets with a lot of segments (because segments get rolled out every 1M events or once they hit 1GB). Segment ids start at 1 for every new dataset. The distance between 100, 101, 102, …, 10n grows very quickly as n increases. Furthermore, the distance between 10n and 10n+1 is much smaller than the distance between m · 10n and m · 10n+1 for larger values of m where 0 < m < 10. This is a fun application of Benford’s law which maintains that real-world data sets of numbers will include many more leading 1s and 2s than 3s and so on. So we can see that this bug becomes increasingly unlikely as segment ids increase. If we accept that hash collisions will have a uniform distribution, we can see that they’re less likely to result in an accidental deletion with segments that begin with a leading 8 than with segments that begin with a leading 1 or 2.
So the hash collisions wouldn’t matter, except that all the rest of the data up until the segment prefix was the same. The rest of the data being the same wouldn’t matter if we had used a trailing slash in the object name when deleting objects from S3. This bug was noticed because we were growing fast and adding more and more teams, who were creating more and more high volume datasets, hence increasing the probability of one of these consequential collisions biting us.
Team Work and Observability
Solving this bug was a lot of fun and took four engineers looking at things from slightly different angles. The solution was simple but figuring out what was happening involved stitching together a series of clues. I don’t know how we would have caught it without custom instrumentation. No auto-instrumentation tool will know that the s3 hash prefix is a very important part of a segment, for example.
Thankfully this system had pretty good instrumentation that gave us observability from a few different angles - all of which ended up being necessary to come to the solution we did in the time we did. We used a fair amount of Honeycomb querying and also had to look at raw access logs — that’s rare in my experience, but further proof that while sampling and aggregation can save on disk space and bandwidth, it’s always nice to be able to get all of the source data you need, even if you have to pull it from cheaper storage.
(Thank you to Fred Hebert and other Honeycombers for reviewing this post and feedback. I hope it was a fun trip down memory lane!)