Sociotechnical Lenses into Software Systems
Software systems are sociotechnical. I don’t think software professionals spend enough time discussing the challenges that span software and personal aspects. When we look at software through a sociotechnical lens, we begin to appreciate the complexity inherent in software development and operations. The systems we are building and operating are constantly being modified by different people, with different contexts, at different times, who may or may not speak to each other directly. This emergent collaboration can present unique challenges that are fun to navigate.
Early in my career, I thought about software systems as static, unchanging entities. If you’ve ever thought of service maps or architectural diagrams as a panacea (instead of yet another lens), or if you’ve ever talked about software being “done,” you’ve probably done the same.
When we think of software this way, though, we miss a fundamental property - people are constantly changing software, and those people almost certainly have different short and long-term goals, contexts, and pressures. Even software in “maintenance mode” has bug fixes, changes in its environment, and changes in the kind of usage patterns it supports.
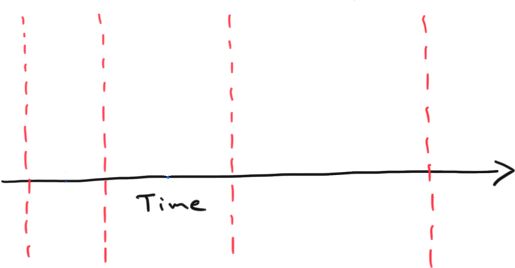
One way to visualize a software system’s lifecycle is with a simple timeline and markers that represent deploys or changes to the software code and configuration. Let’s use red markers to represent deploys:
This visualization makes it clear that the software is changing over time. The new detail is good, as it prepares us for a mental model that embraces that software is a dynamic, ever-changing system. It still leaves a lot out, though.
The above visualization assumes that a software application lives in a perfect world without dependencies or changes in its environment. That’s not true. It’s impossible to separate operations from software development. So let’s add markers (in blue) to represent some of the changes we see in a software application’s environment:
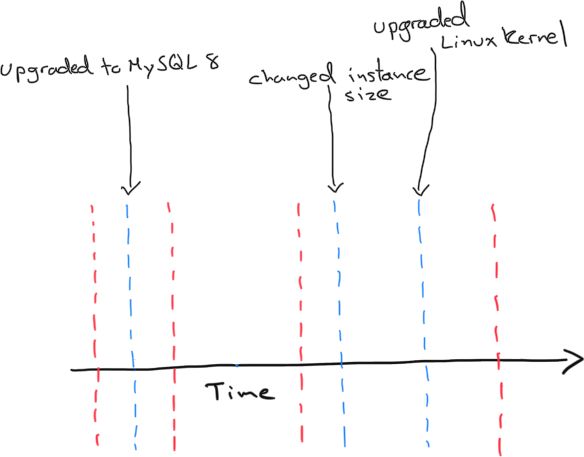
Same system, but now we’ve added information about changes to the operational environment, like upgrading the version of MySQL that this fictional system uses, increasing the instance size of the AWS EC2 instances that this system runs on, or upgrading the OS kernel. These are all routine tasks when operating a web-based software system running in a public cloud environment, and they should impact the way we think about our software systems. The changes might have been made by the team responsible for deploying changes to code or a team responsible for purely operational work.
Our visualization represents a continuously changing system, both in its software code and the operational environment hosting it. These are both in the team’s control or teams responsible for developing and operating this system, but there is still something missing. What about customers or users of this application? They’re constantly interacting with it in ways that will influence its development and operation. Let’s add more markers (in green this time) that represent significant shifts in how users interact with our application:
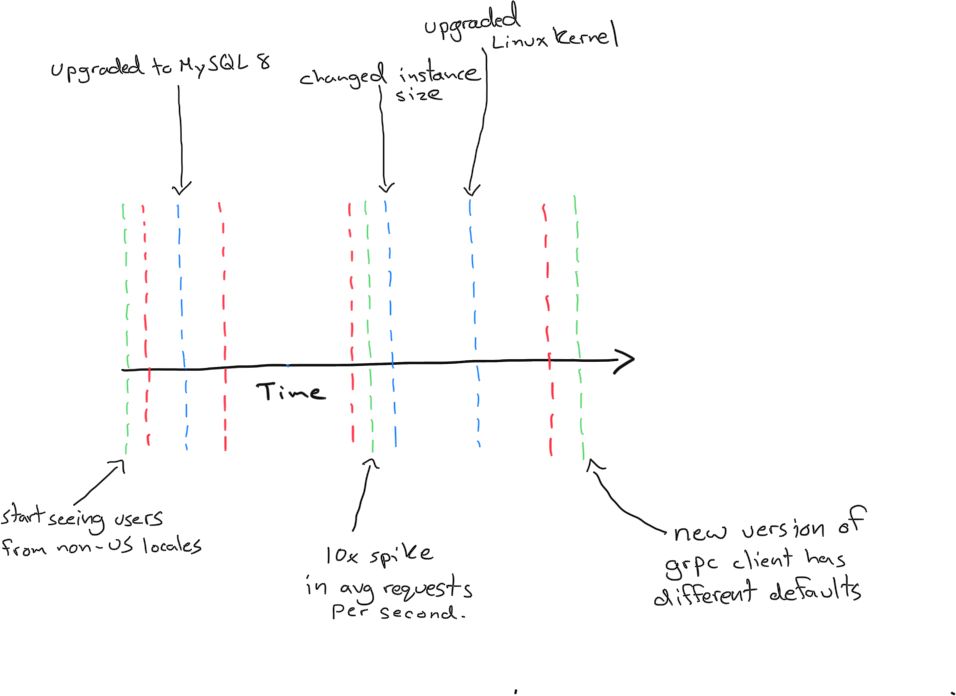
Now that we’ve added humans to our timeline, we can see more of the story. Through this lens, it might become apparent that specific changes in user behavior may have motivated some of the operational changes. The ten-fold increase in average requests per second was probably a motivator in increasing the instance sizes. Or was it? The only people who can answer that are the humans who did the work, and we haven’t added them yet. Let’s add staffing changes to the team or teams responsible for this system. We’ll add these as purple markers:
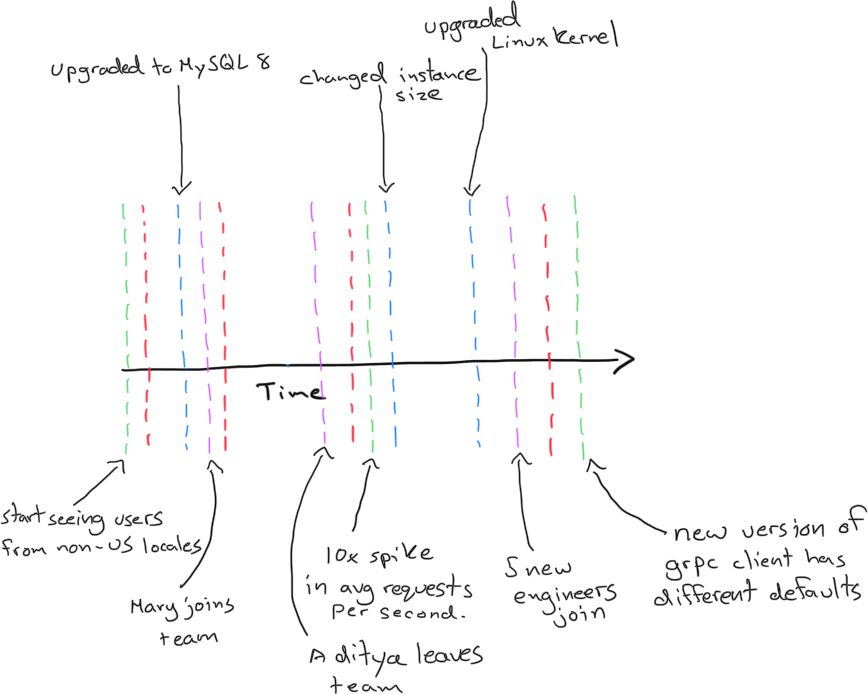
This new dimension adds a fresh perspective to the system. We now know that we can ask Mary about the motivation for changing the instance size. Mary may not know anything about why the team upgraded MySQL when it did, though. In the world Mary lives in, the team has always been running MySQL 8. We know we can’t ask Aditya about the 10x spike in requests because he left the team before it happened. We also can’t ask the five engineers who joined later because that level of traffic has always been customary for them.
When we add human beings to our visualization, it becomes evident that the system is sociotechnical. The humans are doing the work and have the context behind the changes they are making. But where did they get that context? Often it’s from participating in specific incidents. I’m a big fan of the idea that incidents are unplanned investments. The return on those investments is learning. Therefore, the lessons learned from analyzing incidents can reveal important information about your technical systems, organization, and how various parts interact. Let’s add yellow markers for significant incidents into our timeline:
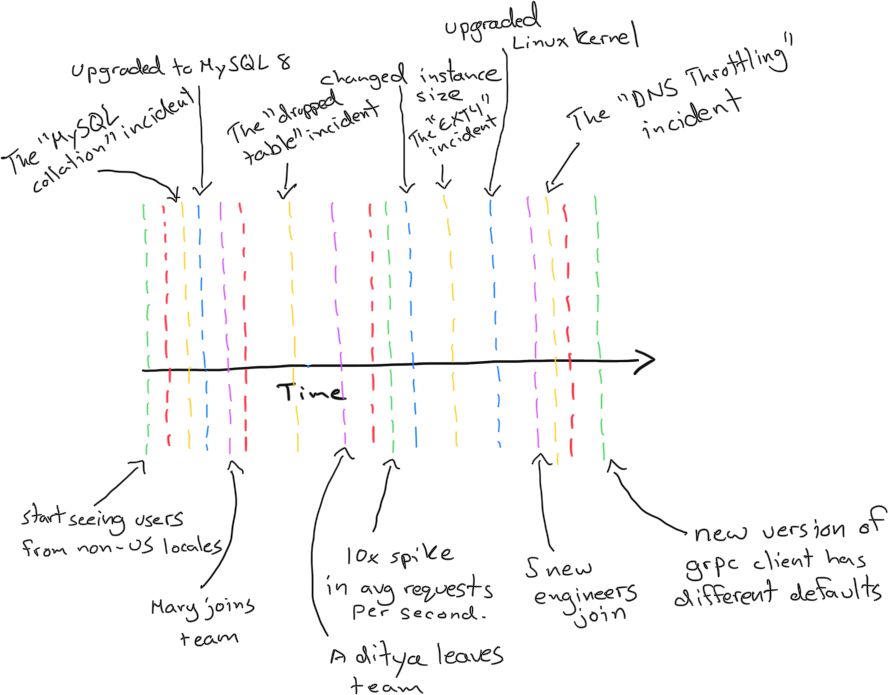
Incidents provide context for the work we do. If we have questions about the MySQL 8 migration, the answers are probably informed by whatever happened in the “MySQL collation” incident. Visualizing our system this way also makes it clear that incidents can be powerful storytelling mechanisms. Investing in good quality incident write-ups can extend the value of incidents for engineers who join after the fact.
Lenses into a System
Each set of markers we added to our system provided new context to form assumptions and frame our thinking. Everything in the visualization existed whether we were looking or not. It becomes clear when looked at this way that each of these dimensions is inextricably linked. It’s impossible to think holistically about software without thinking about the operational environment, or the users of the system, or the people involved in building and maintaining it. These things come together to create another lens through which we can view the world.
It’s important to point out that the final image here is still incomplete. We’ll never fit all of the contexts into a single model. We could keep going, adding more and more context. A fascinating one, for example, would be marking the beginning of the COVID pandemic, when a team that perhaps was colocated started working remotely, and when stress and risk of burnout increased considerably. Otherwise, we’ll eventually include the whole world, but it’s interesting to continually zoom out and see how a new lens helps frame our perspectives.
Embrace Sociotechnical Perspectives
So our systems are sociotechnical. What do you do about this? I think it’s clear that you start by investing in the social parts of the system. If you want to understand why your systems perform the way they do, it’s necessary to know how expertise is created and distributed amongst the people in your organization. The single best way to do this is to invest in incident analysis.
Many organizations have adopted the practice of doing “post-mortems” or “retrospectives” after incidents. Retrospectives are great! Unfortunately, I think a lot of learning is left on the table by the adoption of template-driven processes that produce shallow understandings of what transpired. I’ve spoken about how I think we can improve this. There are also experts in the field who provide training and consulting in incident analysis. There are also communities and companies dedicated to helping you improve this practice.
Investing in incident analysis will empower teams to discover what they know, and almost as importantly, how they know what they know. It’s a necessary part of understanding the social aspects of your system, which hopefully this post demonstrates, are inextricable from any other part.